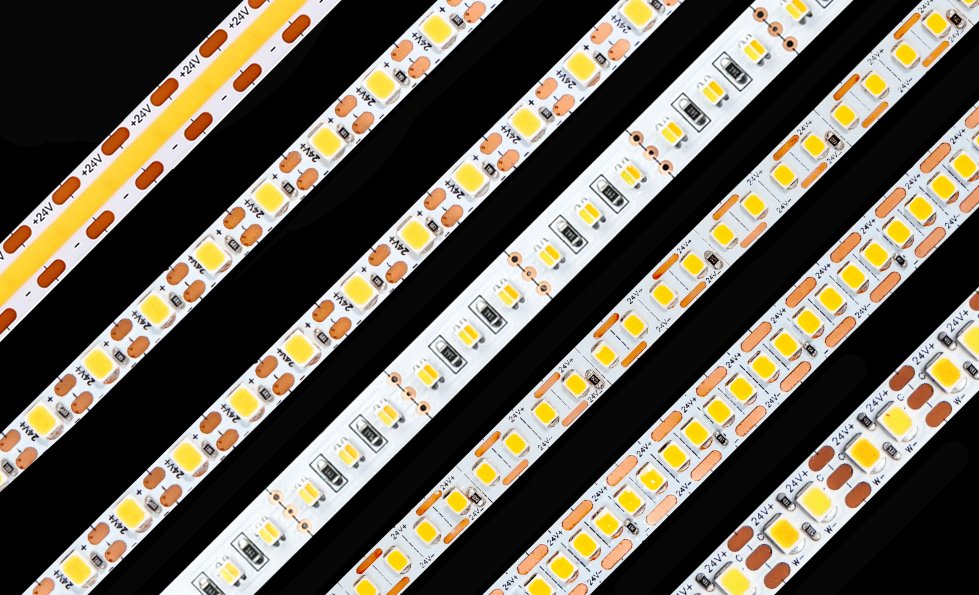
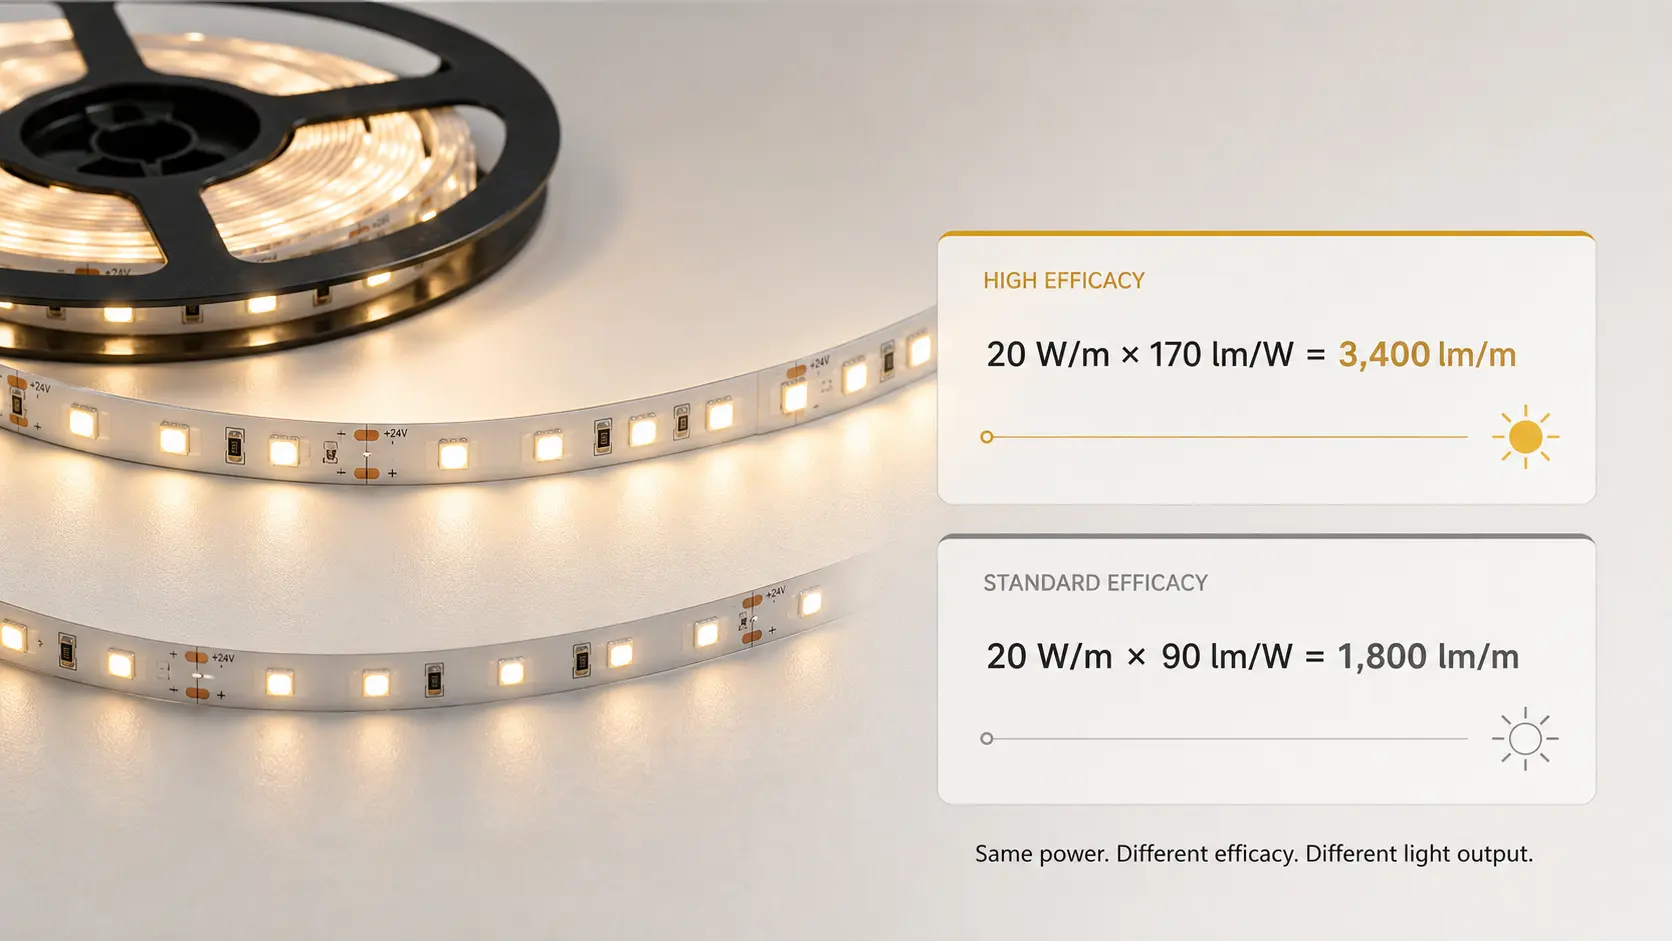
Two LED strips can both be rated at 14.4 watts per meter and still produce completely different amounts of light.
One may deliver 1,400 lumens per meter. Another may exceed 2,000 lumens per meter. A third may look brighter to the eye despite producing fewer total lumens because its light is more concentrated or directly visible.
The reason is simple:
Wattage measures electrical input. It does not measure light output.
Between the power supply and the light reaching a surface, energy is affected by:
- LED package efficacy
- Drive current
- Spectrum, CCT and CRI
- PCB and resistor losses
- Operating temperature
- Voltage drop
- Waterproof materials
- Aluminum profiles and diffusers
- Beam distribution
- Installation geometry
- Driver efficiency
- Product tolerances
- Test conditions
To compare LED strips correctly, buyers need to look beyond W/m and ask where the power was measured, how many lumens were produced and how much useful light reached the project surface.
Quick Answer
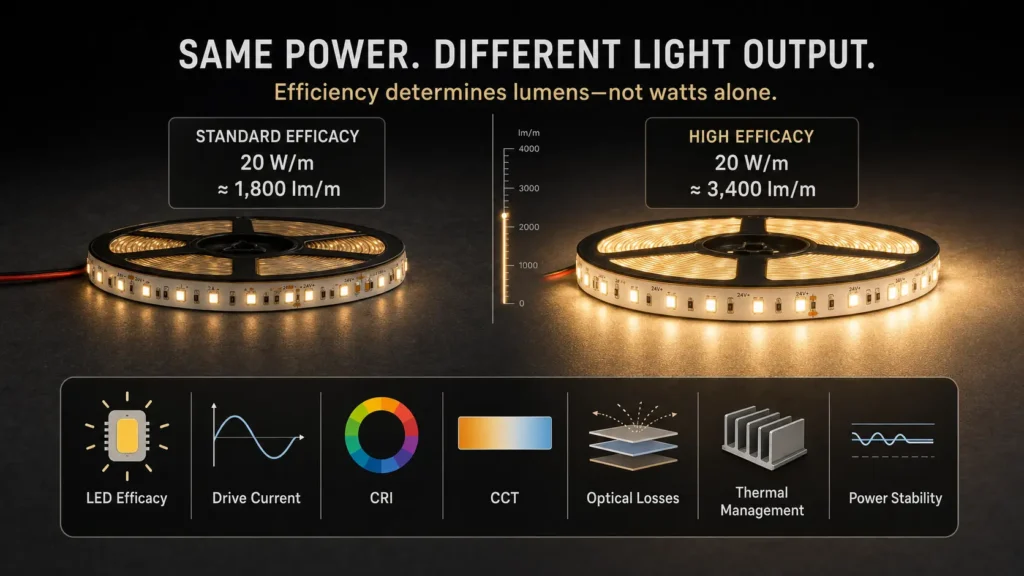
Two LED strips with the same wattage can have different brightness because they convert electrical power into visible light with different efficiencies.
The basic relationship is:
Lumens per meter = watts per meter × luminous efficacy
For example:
LED Strip A
- Power: 14.4 W/m
- Efficacy: 100 lm/W
Light output:
14.4 × 100 = 1,440 lm/m
LED Strip B
- Power: 14.4 W/m
- Efficacy: 160 lm/W
Light output:
14.4 × 160 = 2,304 lm/m
Both products consume the same nominal power, but Strip B produces 60% more lumens.
That does not automatically mean Strip B will create the better installation. The final result also depends on color quality, heat, diffuser losses, beam distribution, profile geometry and where the light needs to go.
The Five Stages Between Watts and Visible Brightness
A useful way to understand the difference is to follow the energy through the complete system.
Rated watts
    ↓
Actual electrical power reaching the strip
    ↓
Light produced by the LED strip
    ↓
Light leaving the profile, diffuser or waterproof jacket
    ↓
Light reaching the target surface
    ↓
Brightness perceived by the observer
Each stage represents a different measurement.
| Stage | Useful metric | What it describes |
|---|---|---|
| Electrical input | W/m | Power consumed per meter |
| Conversion efficiency | lm/W | Visible light produced per watt |
| Strip output | lm/m | Total light produced per meter |
| Directional output | cd or intensity distribution | Where the light travels |
| Light on a surface | lux | Lumens reaching each square meter |
| Visible emitting surface | cd/m² | Luminance in a given viewing direction |
| Human response | Perceived brightness | Subjective visual sensation |
Two products can match at one stage and differ substantially at the next.
1. Different LED Packages Have Different Efficacy
Not every LED converts electricity into light with the same efficiency.
LED package performance depends on:
- Semiconductor design
- Chip size
- Phosphor system
- Package material
- Light-extraction structure
- Thermal path
- Manufacturing quality
- LED bin
- Operating current
- Junction temperature
A high-performance LED package may produce significantly more lumens at the same electrical power than a lower-cost package.
Package size alone does not determine performance.
For example, labels such as 2835, 2216, 3528 or 5050 primarily describe package dimensions. They do not provide enough information to determine:
- Chip size
- Phosphor quality
- Drive current
- Efficacy
- CRI
- Thermal resistance
- Long-term color stability
Two SMD2835 strips can therefore have completely different light output, even when voltage, wattage and LED density appear identical.
LED Binning Matters
LEDs from the same nominal product family may be sorted into different performance groups or bins.
Bins can control characteristics such as:
- Luminous flux
- Forward voltage
- CCT
- Chromaticity
- Color rendering
A manufacturer using a higher-flux bin may achieve more lumens per meter without changing the strip’s nominal wattage.
For repeat commercial orders, request:
- LED manufacturer and series
- Approved flux range
- CCT bin
- Color-tolerance requirement
- Substitution policy
- Batch-to-batch acceptance criteria
2. The Same Wattage Can Be Distributed Across LEDs Differently
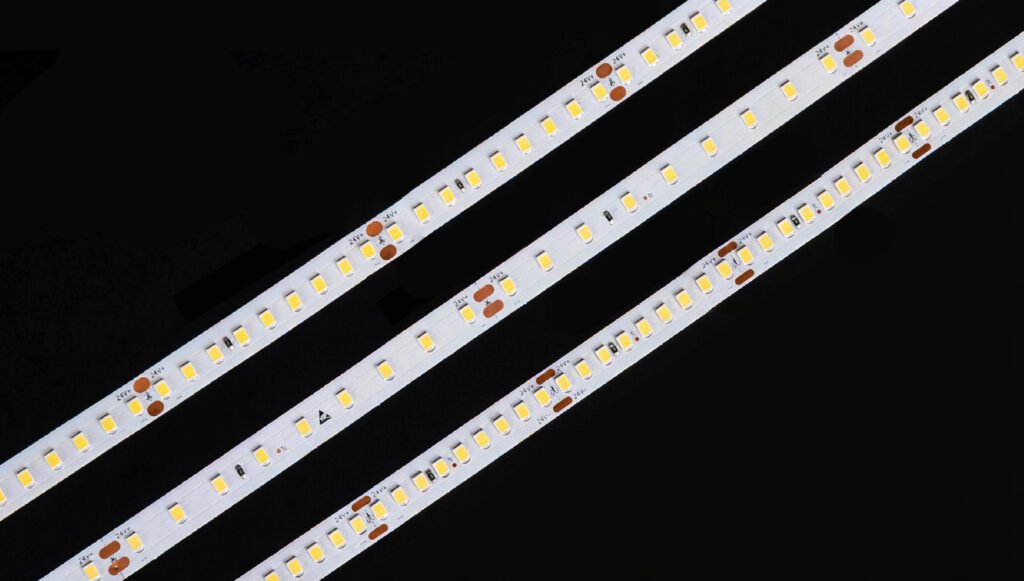
Consider two 14.4 W/m strips:
- Strip A: 60 LEDs/m
- Strip B: 180 LEDs/m
The total rated power is the same, but Strip A may drive each LED harder while Strip B distributes the power across more LED packages.
Driving an LED harder normally increases its individual output, but the increase in light may not remain proportional to the increase in current. This reduction in efficacy at higher current density is known as efficiency droop.
The U.S. Department of Energy identifies current droop and thermal droop as important causes of LED efficiency loss. See the DOE research on LED efficiency droop.
A higher-density strip operating each LED at a lower current may therefore:
- Produce more lumens from the same total wattage
- Distribute heat more evenly
- Create a smoother light line
- Reduce stress on individual LED packages
But higher density is not a guarantee of higher efficacy. Additional LEDs may be lower quality, and the strip may have greater circuit or resistor losses.
Always compare:
- LEDs per meter
- Watts per meter
- Lumens per meter
- Lumens per watt
- Stabilized temperature
3. CCT, CRI and Spectrum Change Lumens per Watt
Lumens are not a measurement of all optical radiation. They are weighted according to the standardized sensitivity of human photopic vision.
The IES definition of luminous flux explains that spectral power is weighted according to the eye’s wavelength-dependent response.
This means two light sources can consume the same wattage but generate different lumen values because their spectra distribute energy differently.
CCT Can Affect Efficacy
Within the same LED product family, cool-white versions sometimes achieve higher efficacy than warm-white versions because of differences in phosphor conversion and spectral design.
However, this is not a universal percentage that applies to every LED strip. Modern package platforms can reduce the difference substantially.
Compare the exact:
- CCT
- CRI
- Spectrum
- Operating current
- Test temperature
Do not compare a 6500K CRI 80 strip directly with a 2700K CRI 95 strip and conclude that the first uses “better LEDs” solely because it produces more lumens.
Higher CRI Can Reduce Efficacy
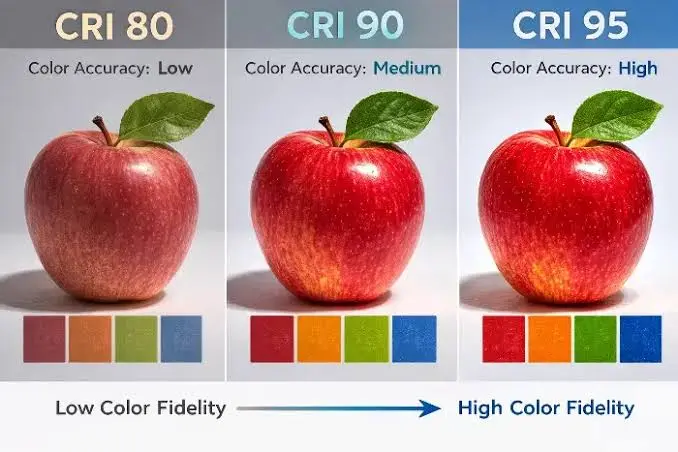
Producing stronger, more balanced spectral content—especially in deeper red wavelengths—can require energy that contributes less strongly to the photopic lumen calculation.
The U.S. Department of Energy notes that improving color fidelity can involve efficiency trade-offs. See DOE LED Basics.
A CRI 80 strip may therefore produce more lumens per watt than a CRI 95 strip, while the CRI 95 product renders materials, skin tones or merchandise more accurately.
The correct decision depends on the application.
Choose Higher Efficacy When:
- Energy use is the primary constraint
- Large areas require general illumination
- Color-critical work is not involved
- Thermal capacity is limited
Choose Better Spectrum When:
- Retail merchandise must look accurate
- Skin tones matter
- Artwork or materials are color-sensitive
- Hospitality atmosphere is important
- Photography or video is involved
Brightness is only one dimension of lighting quality.
4. Rated Wattage May Not Be Actual Wattage
The wattage printed on an LED strip datasheet may represent:
- A nominal value
- A typical value
- A maximum value
- A calculated circuit value
- A one-meter measurement
- A full-reel measurement
- A cold-start measurement
- A stabilized measurement
- Power at the strip input
- Power at the driver output
- Power at the driver AC input
Unless these conditions are stated, “14.4 W/m” may not mean the same thing across suppliers.
Example: Nominal Versus Measured Power
Two strips are both labeled 14.4 W/m.
After stabilization:
- Strip A measures 14.1 W/m
- Strip B measures 11.8 W/m
If Strip B also produces less light, the problem may not be lower LED efficacy. It may simply be drawing less electrical power than its rating suggests.
Possible reasons include:
- Resistor tolerance
- LED forward-voltage variation
- Current-regulator design
- Supply-voltage tolerance
- PCB voltage drop
- Thermal behavior
- Test length
- Measurement method
For procurement, request both nominal and stabilized measured values.
5. Voltage Drop Reduces Power and Brightness Along the Strip
Constant-voltage LED strips do not necessarily receive the same voltage at every point.
Resistance in the PCB causes voltage to decrease along the run. As voltage falls, downstream sections may draw less current and produce less light.
A long strip can therefore have:
- Correct voltage at the input
- High brightness near the feed
- Lower brightness at the far end
- Lower total power than expected
- Visible CCT or RGB mixing changes
Why the Dimmer Strip Can Appear More “Efficient”
This creates a counterintuitive situation.
A long strip suffering from voltage drop may draw less total power because the far end is underdriven. Underdriven LEDs can sometimes operate at relatively high package efficacy.
The resulting average lm/W figure may look acceptable, while the installation has poor visual uniformity.
A good efficacy number does not compensate for an unacceptable end-to-end brightness difference.
Check:
- Test length
- Feed position
- Cable size
- Start voltage
- End voltage
- Start illuminance
- End illuminance
- Actual power per meter
- Maximum permitted output variation
For longer circuits, use the Xmart LED strip voltage-drop and power-injection calculator before approving the power layout.
6. PCB and Circuit Losses Can Consume the Same Watts Without Producing Light
Not all power entering an LED strip reaches the LED junctions.
Energy can be lost in:
- Current-limiting resistors
- Linear current regulators
- PCB conductors
- Connectors
- Solder joints
- Feed cables
- Protection components
For a basic constant-voltage strip, each circuit section needs a method of controlling current. If excessive voltage is dropped across resistors or linear regulators, more power becomes heat rather than light.
Two strips using the same LED packages can therefore have different efficacy because their circuit architectures are different.
Copper Construction Matters
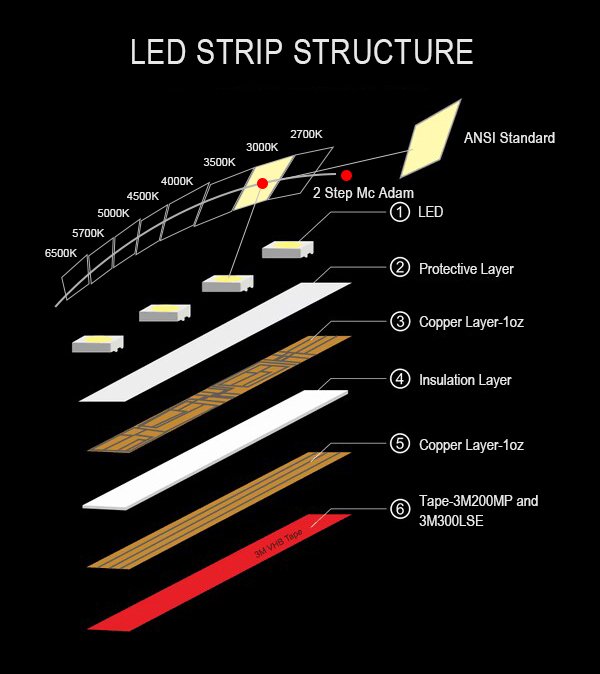
PCB resistance is influenced by:
- Copper thickness
- PCB width
- Conductor width
- Circuit layout
- Length between feed points
- Current per branch
A wider or heavier-copper PCB can reduce resistive loss, but it does not automatically guarantee higher light output. The complete circuit must still be evaluated.
7. Heat Reduces LED Output
LED output is temperature-dependent.
As the LED junction becomes hotter, light output and efficacy generally decline. This is commonly called thermal droop.
Two strips can start at similar brightness and separate after warming up.
Example
At switch-on:
- Strip A: 2,000 lm/m
- Strip B: 1,950 lm/m
After thermal stabilization:
- Strip A: 1,750 lm/m
- Strip B: 1,900 lm/m
Strip A looked brighter during the first measurement but lost more output as its temperature increased.
This is why cold-start readings can be misleading.
What Changes Strip Temperature?
- LED package efficiency
- Watts per meter
- LED current density
- PCB width
- Copper construction
- Waterproof encapsulation
- Aluminum profile
- Mounting surface
- Airflow
- Ambient temperature
- Enclosure size
- Strip-to-profile contact
A strip that produces more lumens during a short integrating-sphere test may not maintain that advantage in a sealed, waterproof or poorly ventilated installation.
Test After Stabilization
A professional test report should state:
- Ambient temperature
- Input voltage
- Mounting method
- Test length
- Aluminum profile or test plate
- Stabilization time
- Measured temperature point
- Final power
- Final lumen output
ANSI/IES LM-79 provides controlled procedures for optical and electrical measurements of solid-state lighting products, including preparation and stabilization. See the IES LM-79 overview.
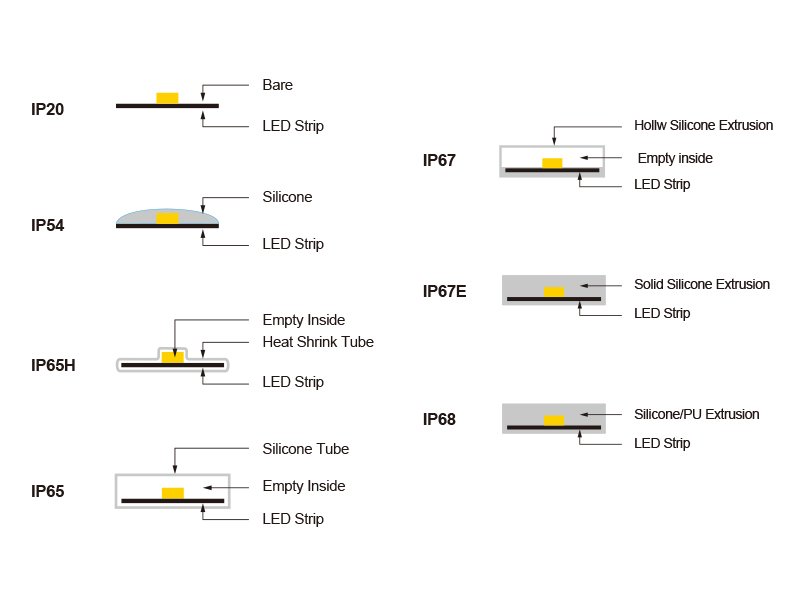
8. Waterproof Construction Can Reduce Usable Output
Waterproof LED strips may place additional material over or around the LEDs.
Common constructions include:
- Nano coating
- Silicone top coating
- Heat-shrink covering
- Silicone tube
- Solid silicone extrusion
- Polyurethane potting
- Complete encapsulation
These materials can affect:
- Optical transmission
- Beam angle
- Color
- Light distribution
- Operating temperature
- Long-term clarity
Two strips can use the same PCB, LEDs and wattage but produce different external light output because one is bare and the other is encapsulated.
Waterproofing Can Affect Brightness Twice
First, the material can absorb, scatter or redirect some light.
Second, the encapsulation can retain heat, raising junction temperature and reducing LED output.
The correct comparison is therefore:
- Bare strip versus bare strip
- Waterproof strip versus the same waterproof construction
- Complete installed assembly versus complete installed assembly
Do not use the bare IP20 lumen value to represent an IP67 or IP68 version unless the manufacturer has verified that configuration.
9. Diffusers and Profiles Change Delivered Brightness
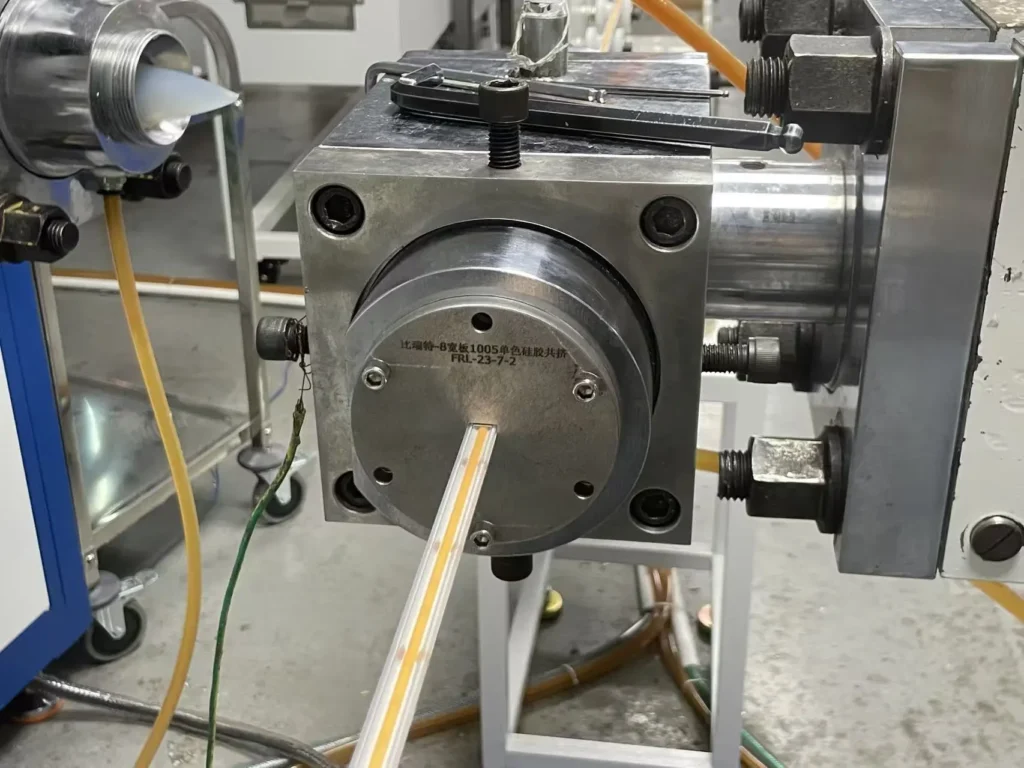
An aluminum profile can improve:
- Heat spreading
- Mechanical protection
- Installation quality
- Visual uniformity
A diffuser can reduce visible dots and glare.
But both alter the optical result.
Diffusers vary in:
- Transmission
- Diffusion strength
- Material
- Thickness
- Surface texture
- UV stability
- Color
- Geometry
A highly diffusing opal cover may create a smoother line while delivering less light than a clearer cover.
The Most Efficient Bare Strip May Not Create the Most Efficient Assembly
Suppose:
Strip A
- Lower LED density
- High bare-strip efficacy
- Requires a heavily diffusing cover
Strip B
- Higher LED density
- Slightly lower bare-strip efficacy
- Works with a clearer cover
After optical losses, their installed performance may be much closer than the bare-strip datasheets suggest.
This is why Xmart recommends matching the LED strip with the actual LED aluminum profile and diffuser before sample approval.
10. Beam Distribution Changes Lux Without Changing Lumens
Lumens measure total light output. Lux measures the amount of light reaching a surface.
Two strips can produce the same lumens but different lux because their light travels in different directions.
Example
A wide-distribution strip spreads light over a large area.
A more directional strip concentrates the same total lumens onto a smaller area.
At the center of the target surface, the directional strip may produce higher lux and appear brighter—even though total lumen output is identical.
Lux depends on:
- Beam angle
- Strip orientation
- Distance to the surface
- Profile lens
- Reflector geometry
- Cove geometry
- Surface angle
- Obstructions
For task lighting, shelf lighting and backlighting, lux or surface luminance may be more useful than lm/m alone.
11. Installation Geometry Can Waste or Use Light Differently
A strip does not illuminate the project in isolation.
The final result is affected by:
- Distance from strip to target
- Surface reflectance
- Surface color
- Cove depth
- Strip orientation
- Profile position
- Diffuser setback
- Surrounding contrast
- Room finishes
A high-output strip aimed into a dark, absorbent cove may deliver less useful light than a lower-output strip positioned correctly against a light, reflective surface.
Surface Reflectance Matters
Light-colored matte surfaces generally return more useful diffuse light than dark surfaces.
Glossy surfaces can create:
- Bright reflections
- Visible LED images
- Glare
- Nonuniform appearance
The strip that appears brightest in a product sample box may not produce the best architectural result after installation.
12. Perceived Brightness Is Not the Same as Measured Lumens
Brightness is a visual sensation, not a single photometric quantity.
The IES distinguishes measurable luminance from subjective brightness. Perception depends partly on luminance and partly on viewing conditions such as visual adaptation. See the IES definition of luminance.
Perceived brightness can be affected by:
- Background contrast
- CCT
- Spectrum
- Glare
- Source size
- Viewing angle
- Adaptation level
- Diffusion
- Surrounding surface color
- Time of day
- Observer sensitivity
A narrow, exposed strip may look painfully bright because of high luminance and glare while delivering relatively little useful illumination to the room.
A diffused strip may look softer at the source while producing better illuminance on the target surface.
Therefore:
Brighter-looking is not always better-lit.
Special Case: RGB, RGBW and RGBCCT Wattage
Power ratings become more complicated for multichannel strips.
RGB Strip
An RGB strip may list maximum power when red, green and blue channels are all operating at full output.
A single color may use only a portion of that power.
The perceived brightness of:
- Red only
- Green only
- Blue only
- Mixed white
- Saturated colors
will be very different, even if the controller command is set to the same percentage.
Green contributes more strongly to photopic lumen measurements than deep red or blue because of the human visual response.
RGBW Strip
An RGBW strip contains a separate white channel.
The rated maximum power may mean:
- RGB channels at full output
- White channel at full output
- All four channels simultaneously
- A controller-limited maximum
- A theoretical sum that the controller never permits
These conditions must be stated.
Mixed RGB white and the dedicated white channel can have different:
- Wattage
- Lumens
- CRI
- CCT
- Tint
- Efficacy
Tunable White Strip
A tunable-white strip usually contains warm-white and cool-white channels.
Its power behavior may follow one of several control strategies:
- Constant total power across the CCT range
- Each channel independently reaches full power
- Both channels can operate at full power simultaneously
- The controller limits the combined output
- Maximum lumens occur near the midpoint
- Maximum power occurs at a different CCT from maximum lumens
A specification such as “19.2 W/m tunable white” is incomplete unless the operating state is defined.
Request power and lumen data at:
- Warmest CCT
- Midpoint CCT
- Coolest CCT
- Maximum permitted combined output
Addressable LED Strip
Addressable strips add IC and control-circuit power.
Actual consumption depends on:
- Number of pixels
- Displayed colors
- Brightness command
- Animation
- Duty cycle
- Controller power limiting
- Idle consumption
- Data architecture
A dynamic animation may draw far less than the theoretical full-white maximum.
The driver should be sized for the defined worst-case operating state, while energy calculations should use the expected operating profile.
Dimming Can Make Wattage Measurements Misleading
PWM dimming rapidly switches the LED load on and off.
At 50% PWM duty cycle, average power may be approximately half of full output, but actual behavior depends on:
- Controller architecture
- PWM frequency
- Current waveform
- Meter sampling
- Driver efficiency
- Minimum load
- Channel interactions
Some basic meters may not measure pulsed loads accurately.
When comparing dimmed strips, define:
- Controller
- Driver
- PWM frequency
- Dimming level
- Measurement equipment
- Measurement point
- Stabilization condition
Also evaluate flicker separately. Two strips at the same average wattage and average output can have different temporal light modulation because of the controller and driver.
Manufacturing Tolerances Create Real Differences
Even correctly labeled strips do not produce one mathematically exact value.
Variation can result from:
- LED flux bins
- LED forward voltage
- Resistor tolerance
- Current-regulator tolerance
- PCB resistance
- Supply voltage
- CCT bin
- Temperature
- Measurement uncertainty
The specification should distinguish:
- Typical value
- Minimum value
- Maximum value
- Production tolerance
- Batch-average value
For procurement, a minimum guaranteed lumen output is usually more useful than a high typical value.
Better Specification
Instead of:
Power: 14.4 W/m
Brightness: high output
Use:
Nominal input: 14.4 W/m
Maximum stabilized input: 15.0 W/m
Minimum stabilized output: 1,900 lm/m
Minimum strip efficacy: 132 lm/W
Test condition: 24V DC, one-meter sample, specified ambient and mounting condition, 4000K, CRI Ra ≥ 90.
Which Brightness Metric Should You Use?
Different applications require different metrics.
| Application | Most useful primary metric |
| General strip comparison | lm/m and lm/W |
| Task lighting | Lux at the task surface |
| Shelf lighting | Lux and uniformity across the shelf |
| Cove lighting | Illuminance on the reflecting surface or in the room |
| Direct-view linear light | Luminance and visual uniformity |
| Backlit stone | Surface luminance and uniformity |
| Signage | Face luminance and uniformity |
| Profile selection | Installed lm/m and dot visibility |
| Energy-code project | Installed system lm/W and W/m |
| Camera environment | Illuminance, spectrum and flicker |
| Retail display | Illuminance, spectrum and vertical uniformity |
“Brightness” should be translated into a measurable project outcome before comparing samples.
A Professional Same-Wattage Comparison Test
Use the following procedure when two supplier samples have the same rated W/m.
1. Confirm Comparable Products
Match:
- Voltage
- CCT
- CRI
- Color mode
- Waterproof construction
- Test length
- PCB width where relevant
2. Use the Same Power Conditions
Use:
- The same regulated power source
- The correct voltage
- Equal cable length and conductor size
- The same feed method
- A verified meter
3. Measure Actual Electrical Values
Record:
- Input voltage
- Current
- Actual watts
- Power per meter
- Start voltage
- End voltage
4. Use the Same Thermal Conditions
Mount both strips:
- On the same type of profile or test plate
- At the same ambient temperature
- With comparable strip-to-profile contact
- For the same stabilization period
5. Measure Optical Performance
Record:
- Stabilized lumens per meter
- Stabilized efficacy
- CCT
- CRI and R9
- Chromaticity
- Spectrum where relevant
6. Test the Installed Assembly
Use the intended:
- Aluminum profile
- Diffuser
- Mounting orientation
- Distance
- Target surface
Measure:
- Installed output
- Lux
- Uniformity
- Profile temperature
- Visible dots
- Glare
- End-to-end variation
7. Repeat at the Maximum Circuit Length
A one-meter comparison does not establish long-run performance.
Test the proposed maximum run and feed arrangement before mass production.
Supplier Comparison Table
| Requirement | Strip A | Strip B |
| Rated W/m | ||
| Stabilized measured W/m | ||
| Minimum lm/m | ||
| Stabilized lm/W | ||
| CCT | ||
| CRI Ra | ||
| R9 | ||
| LED density | ||
| PCB width | ||
| Test length | ||
| Start voltage | ||
| End voltage | ||
| Stabilized temperature | ||
| Waterproof construction | ||
| Diffuser transmission | ||
| Installed lm/m | ||
| Lux at target | ||
| End-to-end uniformity | ||
| Driver AC input | ||
| Installed system lm/W |
This table prevents a supplier from winning the comparison using one isolated maximum value.
Common Buying Mistakes
Comparing Only W/m
Wattage does not indicate how efficiently the strip produces light.
Comparing Only lm/m
Higher output may come from much higher power and heat.
Testing One Strip Bare and One Behind a Diffuser
The measurement boundaries are different.
Comparing Different CRI or CCT Options
The products do not provide equivalent light quality.
Measuring Immediately After Power-On
Cold-start output may not represent stabilized performance.
Using a Phone Camera to Judge Brightness
Automatic exposure, white balance, HDR and tone mapping make uncontrolled photographs unreliable for quantitative comparison.
Using a Phone Lux App as a Certified Measurement
A phone can help identify relative patterns, but sensor calibration, spectral mismatch and geometry can produce significant errors.
Ignoring End-of-Run Performance
Average output can conceal an unacceptable dark end.
Frequently Asked Questions
Does higher wattage always mean a brighter LED strip?
No. Higher wattage provides more electrical input, but brightness depends on luminous efficacy, temperature, spectrum, circuit design and optical losses.
How many lumens should a 14.4 W/m LED strip produce?
There is no universal value. At 100 lm/W it would produce approximately 1,440 lm/m. At 160 lm/W it would produce approximately 2,304 lm/m. CCT, CRI, temperature and construction must be considered.
Why is my LED strip dimmer than the datasheet?
Possible causes include voltage drop, lower supply voltage, thermal droop, diffuser losses, waterproof encapsulation, inaccurate rated power or different test conditions.
Why does one LED strip look brighter even with fewer lumens?
It may have higher luminance, a narrower beam, more glare, a cooler appearance or greater contrast with the background. Perceived brightness is not identical to total luminous flux.
Does a higher LED count make a strip brighter?
Not automatically. More LEDs can share the same total power or increase total power. Compare W/m, lm/m and lm/W together.
Does high CRI make an LED strip less bright?
Higher color-quality requirements can reduce efficacy within some product families, but the size of the trade-off depends on the LED technology and spectrum.
Why is the end of my strip less bright?
PCB and cable resistance cause voltage drop. Shorter branches, larger conductors, center feeding, double-ended feeding, power injection or a higher-voltage architecture may be required.
Can an aluminum profile make a strip brighter?
It can help the strip maintain output by improving thermal conditions. However, its diffuser can reduce external lumens. The complete profile assembly should be tested.
Does waterproofing reduce brightness?
It can. Encapsulation may absorb or scatter light and can increase operating temperature. The amount depends on the waterproof material and construction.
Should I compare LED strips using lux or lumens?
Use lumens per meter for total strip output and lux when evaluating light reaching a specific surface. Direct-view and backlit applications may also require luminance and uniformity measurements.
Specify the Result, Not Just the Wattage
A professional LED strip RFQ should not say only:
24V, 14.4 W/m, high brightness.
It should state:
- Required stabilized lumens per meter
- Maximum permitted W/m
- Minimum lm/W
- CCT and tolerance
- CRI, R9 or spectrum criteria
- Test temperature
- Test length
- Mounting condition
- Waterproof construction
- Maximum run per feed
- End-to-end uniformity
- Profile and diffuser
- Required lux or luminance at the target
- Driver and control condition
Xmart Lighting offers high-efficiency LED strip configurations with multiple density, wattage and CRI options. But product selection should begin with the required installed result rather than the highest catalog lumen number.

For a meaningful comparison, provide Xmart with:
- Target lumens or lux
- Maximum W/m
- CCT and CRI
- Segment length
- Driver location
- Profile and diffuser
- Viewing distance
- Operating environment
- Maximum ambient temperature
- Required certification
- Annual operating hours
The project can then be evaluated using actual light output, power, temperature, voltage drop and installed optical performance.
Two LED strips with the same wattage are not necessarily equivalent products.
The better strip is the one that delivers the required light—at the required surface, color quality and uniformity—with controlled temperature and the lowest practical complete-system power.