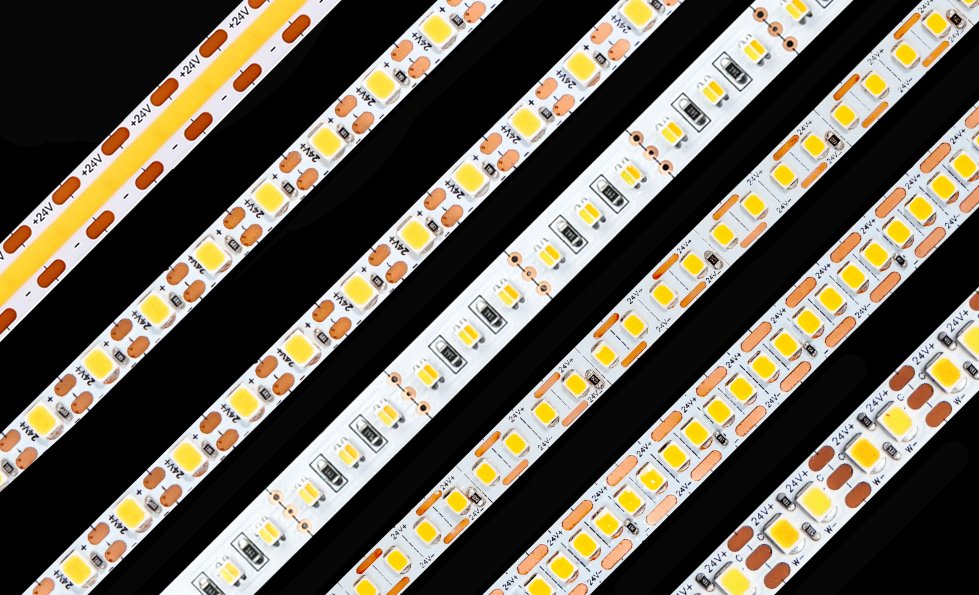
CRI 95 sounds like a complete guarantee of excellent LED color quality.
It is not. Two LED strips can both be labeled CRI 95 and still make skin, red fabric, wood, artwork, cosmetics or food look noticeably different. They can also differ in tint, saturation, reel-to-reel consistency and long-term color stability.
This happens because CRI 95 is only one average color-fidelity score. It does not fully describe:
- Saturated-red rendering
- Changes in color saturation
- Hue distortion
- Green–magenta tint
- Consistency between LED strips
- Spectral continuity
- Metameric mismatch
- Color stability after heating or aging
For professional LED strip specification, CRI should be used together with R9, TM-30 Rf and Rg, SDCM, Duv and the spectral power distribution.
Quick Answer: Why Is CRI 95 Not Enough?
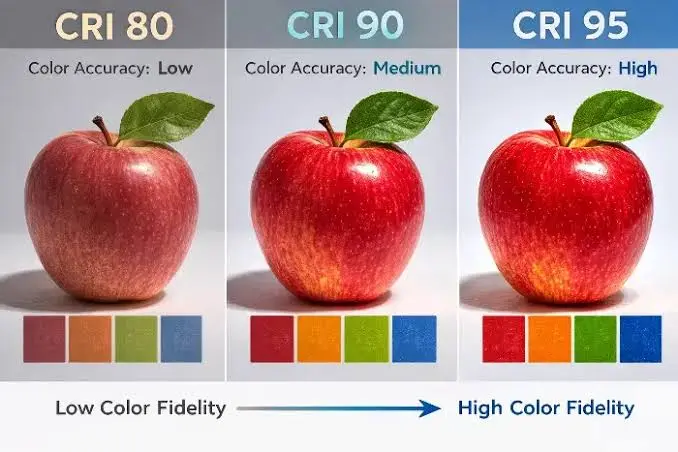
CRI 95 means that a light source renders eight traditional test colors with high average fidelity compared with a reference illuminant of similar correlated color temperature.
It does not prove that the light source:
- Renders saturated red accurately
- Makes colors look naturally saturated
- Avoids hue shifts
- Matches other reels
- Has a neutral tint
- Uses a smooth spectrum
- Maintains the same color when hot
- Performs consistently at every tunable-white setting
A professional high-CRI LED strip specification should include, at minimum:
- CRI Ra
- R9
- CCT
- Duv
- SDCM
- Spectral power distribution
For retail, hospitality, galleries, cosmetics and other color-critical applications, it should also include a TM-30-24 report.
What Each Color Metric Actually Answers
| Metric | Question it answers | What it cannot prove |
|---|---|---|
| CRI Ra | How faithful is the average rendering of eight traditional test colors? | Saturated-red performance, gamut or consistency |
| R9 | How faithfully is one saturated-red test sample rendered? | Overall color quality or every type of red |
| TM-30 Rf | How faithful is the average rendering of 99 color samples? | Whether the result is visually preferred |
| TM-30 Rg | Is the average rendered gamut larger or smaller than the reference? | Which individual hues are distorted |
| TM-30 color vector graphic | Which hue regions are more saturated, less saturated or hue-shifted? | Reel-to-reel color matching |
| CCT | Does the white light appear warm or cool? | Green–magenta tint or object-color fidelity |
| Duv | Is the white point above or below the Planckian locus? | Color rendering or saturation |
| SDCM | How tightly are the chromaticities grouped? | How objects appear under the light |
| SPD | How much relative optical energy is present at each wavelength? | Whether the spectrum is ideal for every application |
| Flicker metrics | How does light output vary over time? | Static color fidelity |
No single metric can describe the complete visual result.
Start with the Correct Question: What Is the Lighting Supposed to Do?
Before selecting color metrics, define the design intent.
There are at least three different goals.
1. Color fidelity
The goal is to make objects look as similar as possible to how they appear under the reference illuminant.
Typical applications include:
- Museums
- Galleries
- Printing
- Paint comparison
- Textile inspection
- Color matching
- Medical visual examination
2. Color preference or vividness
The goal is to make the scene look attractive, rich or appealing rather than perfectly faithful.
Typical applications include:
- Fashion retail
- Food displays
- Hotels
- Restaurants
- Residential interiors
- Entertainment spaces
A small, controlled increase in saturation can sometimes be preferred even though it reduces strict fidelity.
3. Color discrimination
The goal is to help observers distinguish small differences between similar colors.
This can matter in:
- Quality inspection
- Manufacturing
- Healthcare
- Sorting tasks
- Art restoration
- Material selection
CRI 95 does not distinguish between these goals. TM-30 provides more information, but the specifier must still decide what visual outcome is required.
What Does CRI Actually Measure?
CRI stands for Color Rendering Index.
The traditional general CRI value is written as Ra. It compares how selected test colors appear under a test light source and a reference illuminant of approximately the same CCT.
General CRI Ra is calculated from eight test color samples, R1 through R8.
These samples are relatively moderate in saturation:
- R1: light greyish red
- R2: dark greyish yellow
- R3: strong yellow-green
- R4: moderate yellowish green
- R5: light bluish green
- R6: light blue
- R7: light violet
- R8: light reddish purple
The eight results are averaged to produce Ra.
The problem is not that CRI is meaningless. It is that a single average from eight samples hides too much information.
It does not show:
- The direction of a color shift
- Whether colors become more vivid or dull
- What happens to saturated red
- What happens to the many real materials not represented by the test samples
- Whether different LED strips match one another
The CIE has acknowledged limitations in the traditional Ra method, particularly for solid-state lighting. In its 2025 position statement, the CIE recommended that the lighting community begin adopting the newer General Colour Fidelity Index, Rf, while reporting Ra and Rf in parallel during the transition.
Why CRI 95 Can Hide Poor Color Performance
CRI 95 is an average.
Average values can conceal individual weaknesses.
Imagine a student who receives excellent scores in seven subjects but performs poorly in one. The overall average may still look impressive.
The same logic applies to CRI.
A light source can render the eight Ra samples well while performing less effectively on saturated red or other colors not included in the average.
CRI also does not tell us whether the color error moves an object toward:
- Green
- Yellow
- Blue
- Magenta
- Higher saturation
- Lower saturation
That information requires broader metrics and graphical analysis.
Two CRI 95 LED Strips Can Produce Different Results
The following is a hypothetical purchasing comparison designed to illustrate the logic. It is not measured data from a specific Xmart product.
| Metric | LED Strip A | LED Strip B |
| CRI Ra | 95 | 95 |
| R9 | 92 | 42 |
| TM-30 Rf | 92 | 86 |
| TM-30 Rg | 101 | 107 |
| Duv | −0.0005 | +0.0030 |
| Color consistency | 2 SDCM | 5 SDCM |
| Likely visual result | Faithful, neutral and consistent | More saturated overall, greener tint and weaker saturated red |
Both strips carry the CRI 95 label.
However:
- Strip A has stronger saturated-red fidelity.
- Strip B increases average saturation more strongly.
- Strip B has a more positive Duv and may appear greener.
- Strip B has wider chromaticity variation between samples.
- Strip A is more suitable where fidelity and consistency matter.
- Strip B might appear vivid in some scenes, but it is less predictable.
The example shows why CRI 95 cannot be used as a complete product specification.
What Is R9?
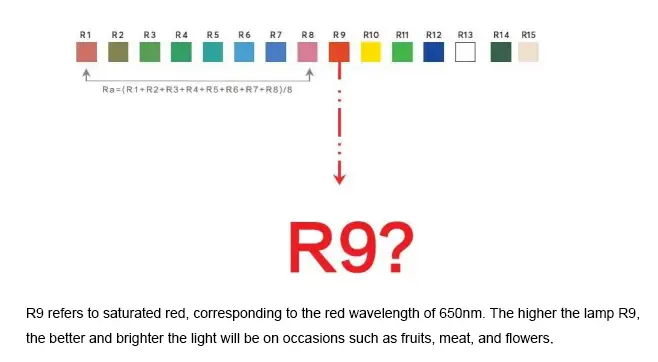
R9 is one of the special color-rendering indices defined within the traditional CRI system.
It measures the fidelity of one saturated-red test sample.
R9 is not included in the general CRI Ra average.
That means a product can have high Ra while having a much lower R9. Special CRI values can even be negative when the color difference from the reference is severe.
R9 is relevant to applications containing significant red spectral content, including:
- Food
- Flowers
- Red textiles
- Timber
- Leather
- Cosmetics
- Artwork
- Warm interior finishes
R9 Is Important—but It Is Not a Skin-Tone Metric
High R9 often improves the appearance of skin because blood and skin reflectance contain important red components.
However, R9 is not specifically a skin-tone index. It represents one standardized saturated-red sample.
Human skin appearance depends on a broader combination of:
- Red fidelity
- Yellow and orange rendering
- Local hue shifts
- CCT
- Duv
- Illuminance
- Surrounding colors
- Observer adaptation
A high R9 value is therefore useful for cosmetics, hospitality and portrait lighting, but it should not be treated as proof that every skin tone will appear ideal.
For skin-critical applications, review:
- R9
- TM-30 red and yellow-orange hue regions
- Duv
- SPD
- Physical mock-ups with multiple skin tones
Is Higher R9 Always Better?
Higher R9 generally means closer fidelity for the standardized saturated-red sample.
However, it does not tell you:
- Whether red objects become more saturated
- Whether their hue shifts toward orange or magenta
- Whether other colors are distorted
- Whether the scene is visually preferred
- Whether different batches match
A high R9 product can still have an undesirable Duv, uneven spectral balance or poor production consistency.
R9 should be used as a screening metric, not as the final color-quality decision.
What Is ANSI/IES TM-30-24?
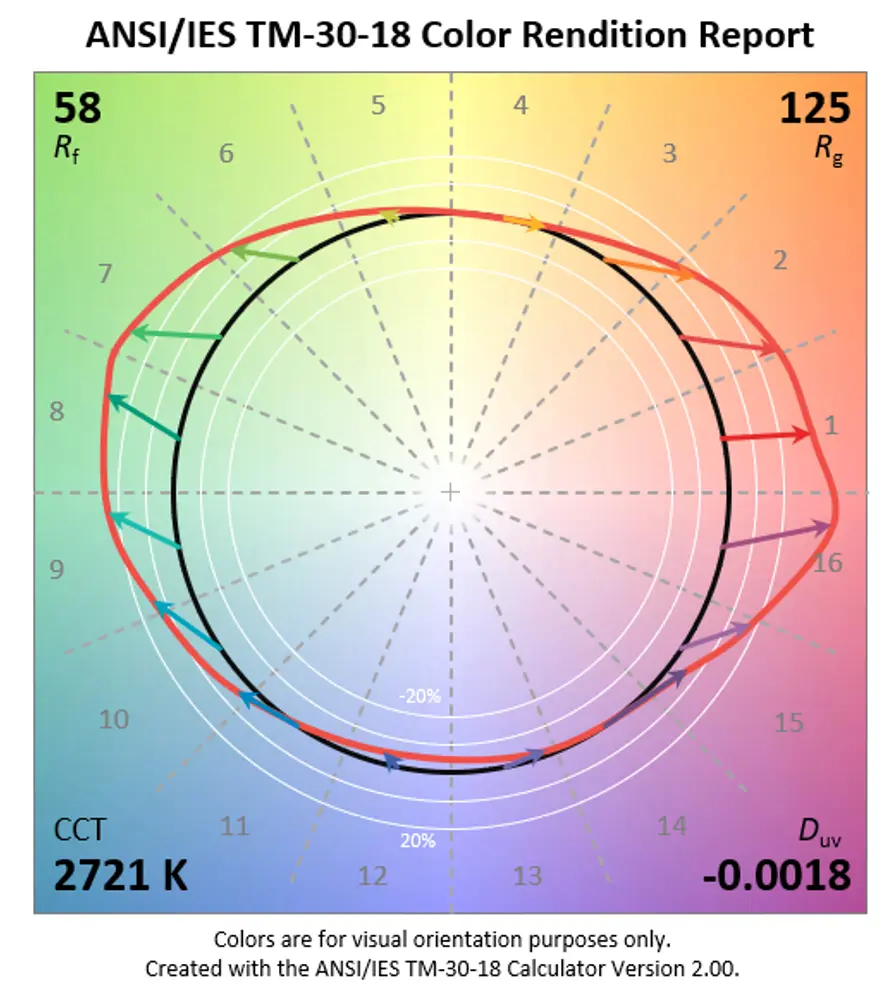
ANSI/IES TM-30-24 is the current IES method for evaluating light-source color rendition.
Unlike general CRI, which averages eight test samples, TM-30 evaluates 99 color evaluation samples selected to provide broader coverage of real-world colors.
TM-30 reports both average and hue-specific information.
Its primary outputs include:
- Fidelity Index, Rf
- Gamut Index, Rg
- Color vector graphic
- Local color fidelity
- Local chroma shift
- Local hue shift
TM-30 is not one “better CRI number.” It is a system for describing several different aspects of color rendition.
CRI Ra vs TM-30 Rf
| Metric | CRI Ra | TM-30 Rf |
| Number of evaluation samples | 8 | 99 |
| Sample diversity | Limited | Broad |
| Color-science framework | Traditional | More modern |
| Hue-specific analysis | Limited | Available |
| Direction of color shift | Not shown | Available through local metrics and graphics |
| Maximum value | 100 | 100 |
Both Ra and Rf describe fidelity to a reference illuminant.
However, their numerical values should not be treated as interchangeable. A source with Ra 95 does not automatically have Rf 95.
The CIE now recommends greater adoption of its General Colour Fidelity Index, Rf. TM-30 reports Rf as part of a broader framework that also includes gamut and hue-specific information.
For current commercial specifications, reporting both Ra and Rf is often the most practical approach.
What Does TM-30 Rf Mean?
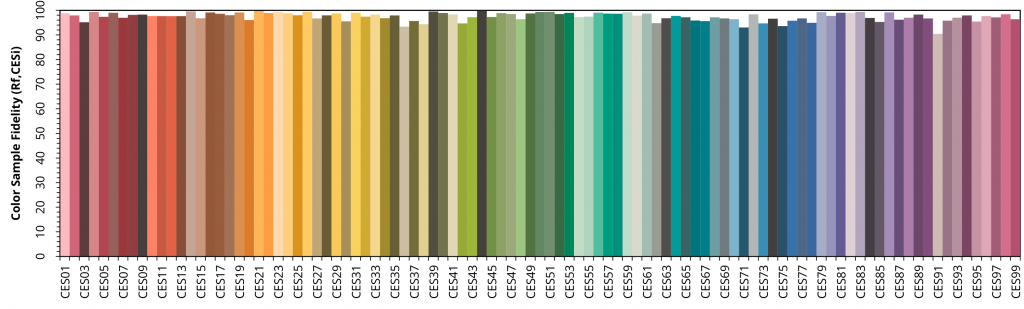
Rf describes average color fidelity across 99 evaluation samples.
- Rf close to 100 indicates high average fidelity.
- A lower Rf indicates greater average color difference from the reference.
- Rf does not show the direction of those differences.
- Rf does not show whether increased saturation is visually desirable.
Rf is more representative than Ra, but it is still an average.
Two sources can have the same Rf while producing different visual results if their errors occur in different hue regions.
One may distort reds while preserving blues. Another may preserve reds but distort green and cyan. Their average fidelity can be similar even though the illuminated scenes look different.
What Does TM-30 Rg Mean?
Rg describes the relative average gamut area of colors rendered by the test source.
In simplified terms:
- Rg around 100 indicates an average gamut area similar to the reference.
- Rg above 100 indicates increased average saturation.
- Rg below 100 indicates reduced average saturation.
Higher Rg is not automatically better.
An Rg above 100 may make food, clothing or an interior look more vivid. But it can also make colors less faithful.
An Rg close to 100 is also not proof of accurate rendering. Increased saturation in one hue region can be offset by reduced saturation in another, leaving the total gamut area near 100.
Always interpret Rg together with Rf and the color vector graphic.
What Is the TM-30 Color Vector Graphic?
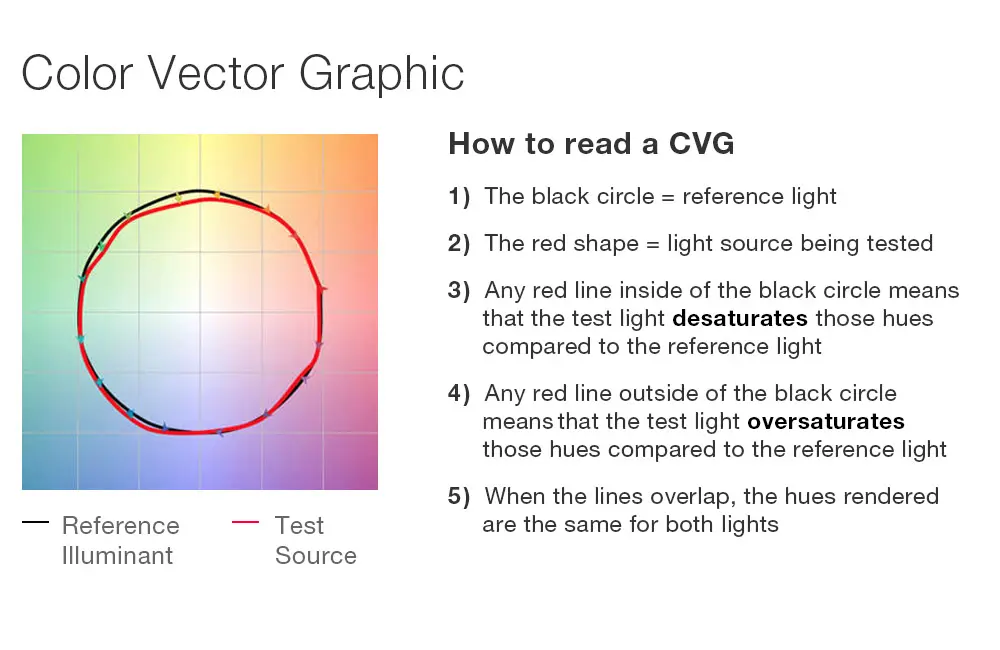
The TM-30 color vector graphic divides the color space into 16 hue-angle bins and compares the test source with its reference.
The reference is represented by a circle. The test source is represented by another line or shape.
Test line outside the reference circle
Colors in that hue region are more saturated than under the reference.
Test line inside the reference circle
Colors in that hue region are less saturated.
Test line rotated relative to the reference
Colors experience a hue shift.
Test line close to the reference
Colors in that hue region have relatively high fidelity.
The color vector graphic reveals information hidden by average values.
For example, two LED strips can both have:
- Ra 95
- Rf 90
- Rg 100
Yet one may reduce red saturation and increase green saturation, while the other does the opposite.
The averages look similar. The vector graphics do not.
What Are TM-30 Local Metrics?
TM-30 provides hue-specific measures for each of its 16 hue-angle bins.
These include:
- Local fidelity, Rf,hj
- Local chroma shift, Rcs,hj
- Local hue shift, Rhs,hj
These metrics are useful when the project depends strongly on a particular group of colors.
Examples include:
- Red and orange for meat, skin and wood
- Green for produce and landscaping
- Blue for fashion, paint and product branding
- Purple for cosmetics and textiles
A complete specification does not always need limits for all 16 bins. The relevant bins should be selected according to the actual materials being illuminated.
Fidelity, Gamut and Preference Must Not Be Confused
A source with high fidelity makes colors look close to the reference.
A source with increased gamut makes colors look more saturated on average.
A preferred source is the one observers like under a particular set of conditions.
These are related but different ideas.
A strict-fidelity spectrum may look natural and accurate.
A mildly saturation-enhancing spectrum may look more attractive in retail or hospitality.
An excessively saturated spectrum may look artificial.
The correct TM-30 targets depend on design intent. There is no single Rf and Rg combination that is optimal for every project, culture, CCT, illuminance and material set.
What Is SDCM?
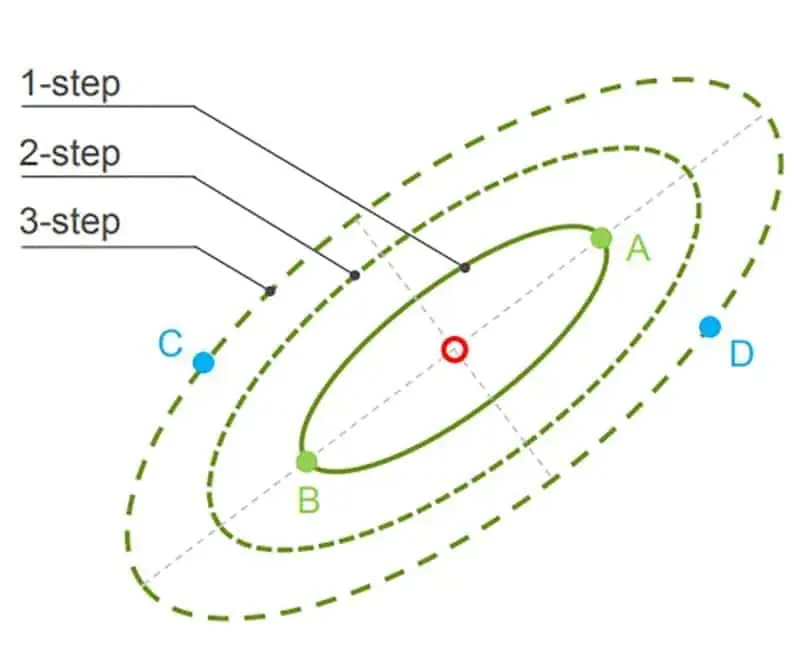
SDCM means Standard Deviation of Color Matching.
It is commonly used with MacAdam ellipses to describe chromaticity variation around a defined target point.
A smaller number indicates a tighter chromaticity grouping.
| SDCM | Practical interpretation |
| 1 SDCM | Extremely tight matching |
| 2 SDCM | Very tight consistency |
| 3 SDCM | Common professional architectural target |
| 4 SDCM | Differences may become visible in sensitive installations |
| 5+ SDCM | Differences can be noticeable when products are adjacent |
These descriptions are practical guidance, not universal thresholds of human perception. Visibility depends on:
- CCT
- Illuminance
- Surrounding colors
- Viewing distance
- Adaptation
- Surface uniformity
- Observer sensitivity
SDCM Does Not Measure Color Rendering
SDCM answers:
“How similar are the white points of different light sources?”
CRI and TM-30 answer:
“How do object colors appear under those light sources?”
A strip can have:
- CRI 95 and 5 SDCM
- CRI 80 and 2 SDCM
- High R9 and inconsistent reel-to-reel tint
- Excellent SDCM and poor color fidelity
A low-SDCM product can be consistently poor at rendering colors.
A high-CRI product can render colors well while different reels visibly mismatch.
Both fidelity and consistency must be specified.
Why “3-Step MacAdam” Is Still Incomplete
A three-step claim is useful only when the ellipse center and production scope are defined.
Buyers should ask:
- What is the target chromaticity coordinate?
- Is the ellipse centered on the approved target?
- Does the limit apply within one reel?
- Does it apply between reels?
- Does it apply across one production batch?
- Does it apply to future orders?
- At what stabilized temperature was it measured?
- Was the bare LED, bare strip or finished waterproof product measured?
Two batches can both fall within separate three-step areas while looking different when installed together.
For repeat orders, the specification should define:
- Target x, y or u′, v′ coordinates
- SDCM limit
- Bin center
- Within-reel tolerance
- Reel-to-reel tolerance
- Batch-to-batch tolerance
- Golden-sample procedure
Xmart’s single-color LED strip range supports project-specific CCT, high-CRI and controlled-binning configurations for architectural and OEM applications.
Initial SDCM Is Not the Same as Maintained Color Consistency
SDCM is often reported only at the beginning of product life.
But LED chromaticity can change because of:
- Operating temperature
- Phosphor aging
- Encapsulant aging
- Moisture
- UV exposure
- Drive current
- Optical-material discoloration
Two reels that begin within three SDCM may age in different directions if their LEDs, phosphors, temperatures or waterproof materials differ.
For long-life projects, initial color matching and maintained color stability should be treated as separate requirements.
What Is CCT?
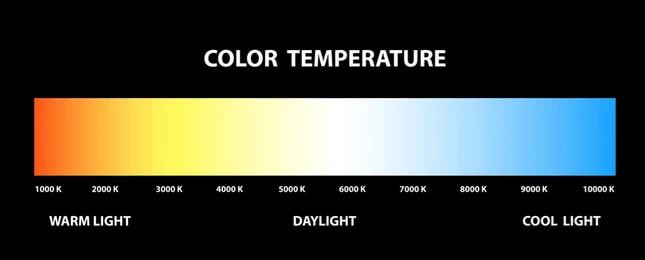
CCT means Correlated Color Temperature.
It describes whether white light appears warm or cool.
Common LED strip CCTs include:
- 1800K: amber-like decorative white
- 2200K: very warm white
- 2700K: warm residential white
- 3000K: warm hospitality and retail white
- 3500K: warm-neutral white
- 4000K: neutral commercial white
- 5000K: cool daylight-like white
- 6500K: very cool daylight white
CCT does not describe color rendering, tint or spectral continuity.
A CRI 80 strip and CRI 95 strip can both be 3000K. Two very different spectra can also produce the same nominal CCT.
Why Two 3000K LED Strips Can Look Different
CCT compresses a two-dimensional chromaticity position into one approximate number.
Two sources can both be labeled 3000K while:
- One looks greenish
- One looks rosy
- One looks yellow
- One looks more neutral
Duv helps explain this difference.
What Is Duv?
Duv describes the distance and direction of a white light source’s chromaticity from the Planckian locus.
In simplified practical terms:
- Positive Duv generally appears greener or more yellow-green.
- Negative Duv generally appears more magenta or rosy.
- Duv close to zero lies near the Planckian locus.
Duv is not a quality score.
A slightly negative Duv may be preferred in residential or hospitality spaces. Another application may require a neutral or slightly positive target.
A complete white-light specification should include:
- Nominal CCT
- Target chromaticity
- Permitted Duv range
- SDCM around the approved target
What Is a Spectral Power Distribution?
A spectral power distribution, or SPD, shows the relative optical power emitted at each wavelength.
The horizontal axis represents wavelength, typically in nanometers.
The vertical axis represents relative or absolute spectral power.
An SPD graph can reveal:
- Excitation peak
- Cyan gaps
- Green-yellow energy
- Red content
- Deep-red extension
- Narrow spectral spikes
- Broad spectral regions
- Differences between warm and cool channels
The SPD is the physical foundation of color rendition.
CRI, R9, Rf, Rg, CCT and other metrics are calculated from, or strongly influenced by, the spectrum.
The spectrum is the source data. The metrics are summaries of selected effects.
How to Read an LED Spectrum
Blue region
A conventional phosphor-converted white LED often has a visible blue excitation peak.
The size of the peak alone does not determine whether the product is good or bad. Its relationship with the rest of the spectrum, CCT, optical output and intended application matters.
Cyan and green regions
Large spectral gaps can affect how certain blue-green and green objects are rendered.
Yellow region
The human photopic sensitivity curve is strong in the green-yellow region, so energy here can contribute efficiently to measured lumens.
Red and deep-red regions
Additional red energy can improve R9 and warm-material rendering. However, deep-red output contributes fewer photopic lumens per optical watt than wavelengths near the peak of human daytime sensitivity.
This helps explain why very high R9 can involve an efficacy tradeoff.
Why Two Sources with the Same CRI Can Have Different Spectra
CRI is not a spectral-shape score.
Different combinations of wavelengths can produce similar color coordinates and similar average CRI results.
This is possible because the human visual system reduces a complex spectrum to three cone responses. Different spectra can therefore produce the same apparent white point.
The objects under those spectra may still look different because every material reflects wavelengths differently.
This is one source of metamerism.
What Is Metamerism?
Metamerism occurs when two colors appear to match under one light source but no longer match under another.
For example:
- Two fabrics may look identical in a showroom but different in daylight.
- A printed package may match a brand standard under one LED and fail under another.
- Two paint samples may match under 3000K light but separate under 4000K light.
CRI 95 does not eliminate metameric mismatch.
For color-sensitive projects, evaluate the actual:
- Fabrics
- Paints
- Artwork
- Packaging
- Cosmetics
- Wood finishes
- Food products
- Brand colors
A laboratory metric cannot represent every material used in a real project.
Does “Full Spectrum” Have a Standard Meaning?
“Full spectrum” is widely used in lighting marketing, but it is not a complete technical specification.
The term alone does not define:
- Minimum Ra
- Minimum R9
- TM-30 performance
- Spectral smoothness
- Duv
- SDCM
- Blue-light content
- Circadian effect
- Visual comfort
- Photobiological safety
Two products marketed as full spectrum can have very different spectral power distributions.
Before approving a full-spectrum strip, request:
- SPD graph
- CCT
- Duv
- CRI Ra
- R1–R15 values
- R9
- TM-30 Rf and Rg
- TM-30 vector graphic
- Luminous efficacy
- Test conditions
“Full spectrum” should begin a technical evaluation, not replace one.
Blue-Pump vs Violet-Pump LEDs
Most conventional white LEDs use a blue LED die and a phosphor mixture.
Part of the blue light passes through, while part is converted into longer visible wavelengths.
Some natural-spectrum LEDs use violet excitation with multiple phosphors to create a broader visible spectrum.
Depending on the product, violet excitation can provide:
- A smoother spectral shape
- Better coverage of some wavelength regions
- High color fidelity
- Less dominance by a narrow blue peak
But excitation method alone does not prove:
- Better visual comfort for every person
- Better health outcomes
- Better circadian performance
- Greater photobiological safety
- Higher energy efficiency
Those claims require separate measurements and application-specific evidence.
Xmart’s SunLike LED strip uses a violet-excitation SMD3030 platform for projects that prioritize natural-spectrum characteristics and high color fidelity. Selection should still be based on the complete SPD, color metrics, efficacy and final application—not the SunLike name alone.
CRI 95 vs High Luminous Efficacy
High color fidelity and high efficacy can involve a tradeoff.
Deep-red wavelengths are important for R9 and spectrum completeness, but they contribute fewer photopic lumens than wavelengths near the peak of daytime human sensitivity.
Phosphor conversion also introduces energy loss.
For otherwise similar LED technologies, a CRI 95, R9 90 source may therefore have lower lm/W than a CRI 80 source optimized primarily for photopic efficiency.
However, the size of this tradeoff depends on:
- LED generation
- Die quality
- Phosphor formulation
- CCT
- Drive current
- Thermal design
- PCB resistance
- Driver efficiency
A modern, well-designed CRI 95 strip can outperform an older or poorly designed CRI 80 strip.
Compare actual test data.
Xmart’s high-efficiency LED strip range is designed for projects where lm/W is the primary objective. For retail, hospitality and color-critical projects, efficacy should be balanced against R9, TM-30 and SPD requirements.
LED Strip Variables That Can Change Color Performance
LED strip color quality is not determined by the LED package alone.
PCB temperature
Higher temperature can reduce output and shift chromaticity.
Voltage drop
On conventional constant-voltage strips, voltage drop can change current along the run. This may create output and color differences between the beginning and end.
PCB resistance
Narrow PCB conductors, low copper weight and high power can increase end-to-end variation.
Waterproof encapsulation
Silicone, PU and other materials can change output, CCT and Duv.
Aluminum profile and diffuser
Optical materials can absorb different wavelengths unequally and alter the final spectrum.
Production binning
Packages or dies from different bins can create visible differences between reels.
Controller and dimming method
Multichannel mixing, low PWM resolution and unequal channel curves can change the resulting white point.
The complete installed system should be evaluated—not only the LED package datasheet.
COB vs SMD Color Quality
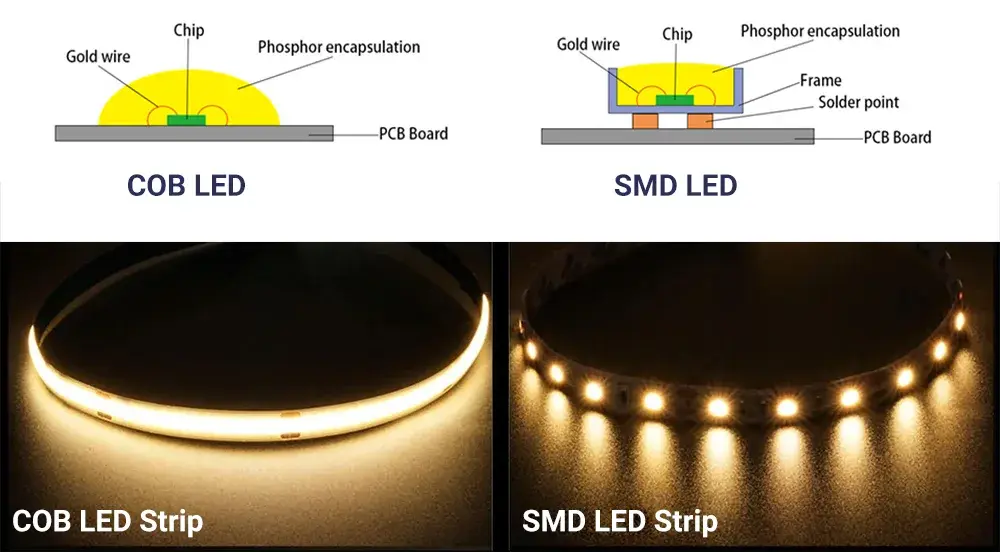
Neither COB nor SMD automatically provides better color rendering.
SMD color performance depends heavily on:
- Package spectrum
- Package binning
- Placement consistency
- Thermal design
COB color performance depends on:
- Die binning
- Phosphor formulation
- Coating thickness
- Encapsulation uniformity
- Curing process
- Thermal design
COB may provide better spatial blending along the emitting surface, but that does not guarantee better R9, TM-30 or batch consistency.
For direct-view lighting, compare color metrics and visual uniformity separately.
Tunable White Requires More Than Endpoint Testing
A tunable-white strip combines warm-white and cool-white channels.
Intermediate color temperatures are created by mixing those two spectra.
A product can perform well at both endpoints but behave differently at intermediate settings.
Possible issues include:
- Duv moving above or below the desired path
- Reduced R9 at the midpoint
- Lower combined efficacy
- Unequal warm and cool output
- CCT jumps during dimming
- End-to-end channel imbalance
- Different maximum power depending on the scene
Test at least:
- Warmest CCT
- Coolest CCT
- Nominal midpoint
- Common programmed scenes
- Low dimming level
- Maximum permitted combined output
Xmart’s tunable-white LED strip range includes SMD and COB architectures for different profile, output and control requirements. Project data should cover the actual CCT settings used, not only the endpoints.
Waterproofing and Diffusers Can Change the Test Result
A bare LED strip report does not necessarily describe the finished installation.
Silicone coating, solid extrusion, PU encapsulation and diffusers can change:
- Luminous flux
- CCT
- Duv
- SPD
- Beam distribution
- Temperature
- Color consistency
The effect may also change as the material ages.
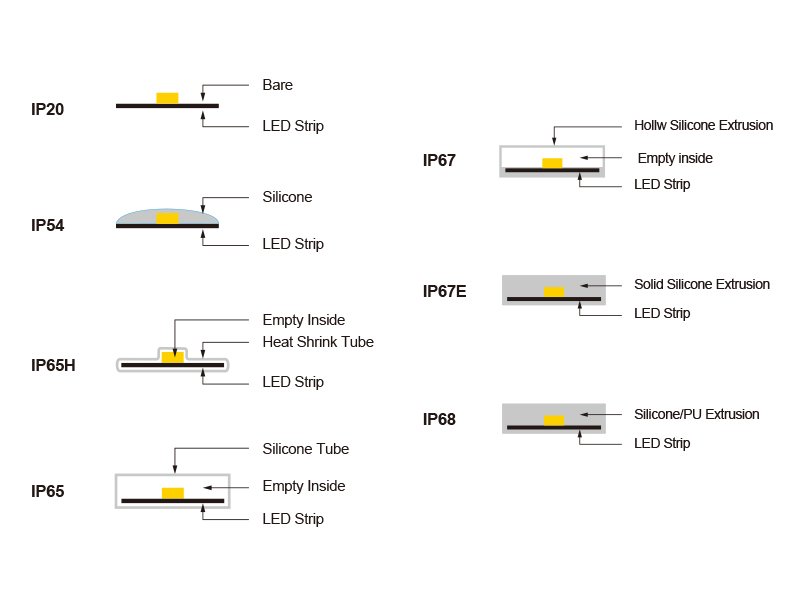
For an IP67 project, approve the IP67 sample and report. Do not rely only on data from the IP20 version.
For a profile installation, test the strip behind the specified diffuser.
Four Levels of Professional Color-Quality Approval
Level 1: Source qualification
Review the technical data for the proposed LED package or COB platform:
- CRI
- R9
- TM-30
- SPD
- CCT
- Duv
- Binning
- Temperature conditions
Level 2: Finished-strip qualification
Test the complete LED strip, including:
- PCB
- Resistors or ICs
- Actual power per meter
- Production LED density
- Waterproof construction
- Sample length
Level 3: Installed-system qualification
Test the strip in the actual:
- Aluminum profile
- Diffuser
- Mounting position
- Operating temperature
- Dimming system
- Viewing environment
Use the real merchandise or materials whenever possible.
Level 4: Production-batch validation
Inspect multiple samples from:
- Different positions on one reel
- Different reels
- Different cartons
- The start and end of production
- Repeat orders
This four-level process separates a good laboratory LED from a consistently good finished project.
What Should an Integrating-Sphere Report Include?
A traceable report should identify:
- Manufacturer or laboratory
- Test date
- Product code
- Batch code
- Sample length
- Input voltage
- Input current
- Actual power
- Luminous flux
- Luminous efficacy
- CCT
- Duv
- Chromaticity coordinates
- CRI Ra
- R1–R15
- R9
- SPD graph
- Ambient temperature
- Stabilization method
For color-critical projects, also request:
- ANSI/IES TM-30 version
- Rf
- Rg
- Color vector graphic
- Local hue-bin data
- Test-equipment identification
A report without a matching product code or test configuration has limited procurement value.
Color-Quality Report Red Flags
Be cautious when:
- Only “CRI 95” appears, with no R9.
- No SPD graph is available.
- The report does not identify the product code.
- One LED package is tested instead of the complete strip.
- A short low-power sample is used to represent a high-power reel.
- The IP20 report is used for an IP67 product.
- Tunable-white data is provided only at one endpoint.
- SDCM is stated without a target coordinate.
- The report omits input power or test temperature.
- The report belongs to a different LED bin.
- The supplier cannot explain repeat-order color control.
- A spectrum image is shown without numerical test data.
- “Full spectrum” is used as a substitute for measurable criteria.
Illustrative Specification Starting Points
These values are preliminary screening examples, not universal standards. Final limits should reflect the application, project standard and lighting designer’s intent.
| Application | Ra | R9 | TM-30 starting point | SDCM | Additional requirement |
| General commercial interior | ≥90 | ≥50 | Consider Rf ≥85 | ≤3 | Control CCT and Duv |
| Hotel or restaurant | ≥90 | ≥80 | Review Rf, Rg and red region | ≤3 | Test skin, food and timber |
| Fashion retail | ≥90 or ≥95 | ≥80 | Rf and hue-specific review | ≤3 | Test fabrics and brand colors |
| Cosmetics | ≥95 | ≥90 | Rf ≥90 as a starting point | ≤2–3 | Review red/orange hue bins and Duv |
| Food retail | Application-specific | Strong red often required | Controlled gamut enhancement may be useful | ≤3 | Test the actual products |
| Gallery or museum | ≥95 where required | ≥90 | High fidelity and vector review | ≤2 | SPD and conservation review |
| Color inspection | Project-specific | Project-specific | Tight local fidelity limits | ≤2 | Reference illuminant and metamerism testing |
| Premium residential | ≥90 | ≥50–80 | Optional TM-30 review | ≤3 | Preferred CCT and Duv |
Do not copy these values into every specification without considering the design objective.
Example of a Better LED Strip Specification
A weak specification says:
“LED strip, 3000K, CRI 95.”
A stronger example says:
“24V LED strip, nominal 3000K, CRI Ra ≥95, R9 ≥90, ANSI/IES TM-30-24 Rf ≥90, project-approved Rg range, maximum 3 SDCM to the approved chromaticity target, controlled Duv range, with traceable SPD and integrating-sphere report submitted for approval.”
A color-critical project may also define:
- Target x, y or u′, v′ coordinates
- Local TM-30 hue requirements
- Maximum within-reel variation
- Maximum reel-to-reel variation
- Golden sample
- Approved final IP construction
- Approved profile and diffuser
- Stabilized operating temperature
- Repeat-order matching policy
- Change-notification procedure
The exact Rg and Duv limits should be chosen according to design intent rather than copied from a generic template.
Questions to Ask an LED Strip Manufacturer
Before approving a high-CRI strip, ask:
- Is CRI the Ra value or another metric?
- What is the R9 value?
- Can you provide R1–R15?
- Is TM-30-24 data available?
- What are Rf and Rg?
- Can you provide the color vector graphic?
- What is the SPD?
- What are the CCT and Duv tolerances?
- What is the SDCM target and ellipse center?
- Does SDCM apply within a reel, between reels or between batches?
- At what temperature was the strip tested?
- Was the final waterproof construction tested?
- Was the strip tested inside the specified profile?
- How are repeat orders matched?
- What happens if the LED bin or phosphor changes?
These questions separate a high-CRI marketing claim from a controlled lighting product.
Common Misunderstandings
CRI 95 means every color is 95% accurate
False. CRI is not a percentage and Ra is an average of eight calculated sample scores.
R9 is included in CRI Ra
False. R9 is a supplementary special index.
R9 measures skin tone
Incomplete. R9 measures one saturated-red sample. Skin appearance depends on more than R9.
Rg above 100 is always better
False. It indicates increased average gamut, which may be preferred or may be inaccurate.
SDCM measures color rendering
False. It measures chromaticity consistency.
Same CCT means the same white
False. Different Duv and chromaticity coordinates can create different tint.
Same CRI means the same spectrum
False. Different SPDs can produce similar CRI values.
Full spectrum guarantees natural or healthy light
False. The term needs supporting spectral and application-specific evidence.
A bare-strip report describes the installed fixture
Not necessarily. Diffusers, profiles, temperature and waterproof materials can alter the result.
Endpoint data is enough for tunable white
False. Intermediate channel mixes can have different Duv, R9, efficacy and output.
Final Recommendation
CRI 95 is a useful starting point, but it is not a complete LED color-quality specification.
Use Ra as a familiar first filter.
Use R9 to detect weak saturated-red fidelity.
Use TM-30 Rf to evaluate broader average fidelity.
Use Rg and the color vector graphic to understand saturation and hue-specific distortion.
Use SDCM to control matching between strips, reels and production batches.
Use CCT and Duv to define the white point and tint.
Use the SPD to understand the spectral foundation behind all the summary metrics.
Then validate the complete strip inside the actual profile, diffuser, waterproof construction and control system.
The best high-CRI LED strip is not the product with the largest number printed on its datasheet.
It is the product whose spectrum, color rendering, chromaticity and production consistency are measured, controlled and appropriate for the materials it will illuminate.
Frequently Asked Questions
Is CRI 95 good for LED strip lighting?
Yes. CRI 95 indicates high average color fidelity, but R9, TM-30, Duv, SDCM and spectrum should also be checked for color-critical projects.
Can two CRI 95 LED strips look different?
Yes. They can have different R9, Rf, Rg, Duv, spectra and color consistency even though they share the same Ra value.
Is CRI a percentage?
No. CRI is an index calculated from color differences relative to a reference illuminant. CRI 95 does not mean colors are “95% accurate.”
What is a good R9 value?
It depends on the application. R9 ≥50 may be used as an initial general-lighting target, while hospitality, retail, cosmetics, food and galleries may require R9 ≥80 or ≥90.
Can CRI 95 have low R9?
Yes. R9 is not included in general CRI Ra. Always request it separately.
Is R9 a skin-tone score?
No. It is a saturated-red fidelity score. It is relevant to skin appearance but does not describe every skin tone.
Is TM-30 better than CRI?
TM-30 provides a more complete analysis using 99 samples, gamut information and hue-specific graphics. CRI remains widely used, so reporting both is currently practical.
What is the latest TM-30 version?
The current IES publication is ANSI/IES TM-30-24. Reports should identify which version was used.
What does TM-30 Rf mean?
Rf describes average color fidelity across 99 evaluation samples. Higher Rf means closer average fidelity to the reference.
What does TM-30 Rg mean?
Rg describes relative average gamut area. Above 100 generally indicates increased saturation; below 100 indicates reduced saturation.
Is higher Rg better?
Not always. The correct gamut depends on whether the project prioritizes fidelity, vividness or preference.
What is the difference between CRI and SDCM?
CRI describes how object colors are rendered. SDCM describes how closely the white points of different light sources match.
Is three SDCM good?
Three SDCM is a common professional architectural target. More demanding adjacent or color-critical installations may require tighter control.
Why do two 3000K strips look different?
They may have different Duv, chromaticity coordinates, spectra or operating temperatures even though their nominal CCT is the same.
What is Duv?
Duv describes the direction and distance of a white point from the Planckian locus. Positive Duv generally appears greener; negative Duv generally appears more rosy or magenta.
Is full-spectrum LED the same as high CRI?
No. High CRI is a measured fidelity result. Full spectrum is an incomplete marketing description unless supported by an SPD and additional metrics.
Does high CRI reduce efficiency?
It can involve an efficacy tradeoff, especially when more deep-red output is added. The actual result depends on the LED technology, CCT, current and thermal design.
Can waterproofing change LED color?
Yes. Silicone, PU and extrusion materials can affect output, CCT, Duv and spectrum.
Does dimming change CRI?
Single-channel PWM dimming may preserve the spectrum reasonably well, but controller behavior, analog dimming, temperature and multichannel mixing can change color performance.
How should tunable-white strips be tested?
Test the warm endpoint, cool endpoint, midpoint, important programmed scenes, low dimming levels and maximum permitted combined output.
Need a Complete High-CRI LED Strip Specification?

Xmart Lighting supports high-CRI, high-R9, controlled-SDCM and natural-spectrum LED strip development for lighting brands, distributors and commercial projects.
Depending on the project, Xmart can assist with:
- CRI Ra and R1–R15
- R9
- TM-30 Rf and Rg
- Spectral power distribution
- CCT and Duv
- SDCM and binning
- Luminous efficacy
- COB, CSP and SMD options
- Tunable-white testing points
- Waterproof constructions
- Batch-control requirements
- Custom PCB and packaging
For qualified OEM and project enquiries, supporting documentation can be matched to the exact product configuration, wattage, CCT, IP construction and production requirements.
Explore the Xmart SunLike natural-spectrum LED strip, single-color LED strip range and tunable-white LED strip solutions, or send Xmart your target color metrics and application materials for a project-specific evaluation.