
How Does Power Load Affect Voltage Drop in a 24V LED Strip?
In this comparison, all three samples were measured from a 24.00V strip input over the same 5-meter distance. Sample A recorded a 4.12% drop at 5 meters, while Sample B recorded 7.54% and Sample C recorded 10.00%.
Under the 5% internal comparison criterion used for this test, Sample A remained below 5% through 5 meters, Sample B through 2 meters and Sample C through 1 meter.
These distances are measured decision points from this test—not universal maximum run lengths for every 24V LED strip. When comparing systems, understanding 12V vs 24V vs 36V vs 48V LED Strip architectures is critical.
Test Scope and Measurement Method
- Test date
- July 7, 2026
- Test location
- Shenzhen engineering and QC operation supporting Xmart Lighting programs
- Samples
- Three anonymous 24V, 5m LED strip configurations
- Sample condition
- Measured before final solder-pad tinning and final connector assembly
- Environment
- 22–28°C, 30–70% RH
- Equipment
- Regulated DC power supply and digital multimeter
- Reference voltage
- 24.00V measured at the LED strip input under load
- Measurement points
- 1m, 2m, 3m, 4m and 5m
What This Test Includes
The test compares electrical voltage measured at increasing distances along each LED strip after current stabilization. Voltage-drop percentage is calculated from the 24.00V measurement at the strip input.
What This Test Does Not Include
The test does not include final production cables, connectors, solder joints, aluminum profiles, waterproof processing, installation temperature or photometric measurements. These factors must be verified separately on the final assembly. For a comprehensive overview of our testing protocols, visit the LED Strip QC & Testing Hub.
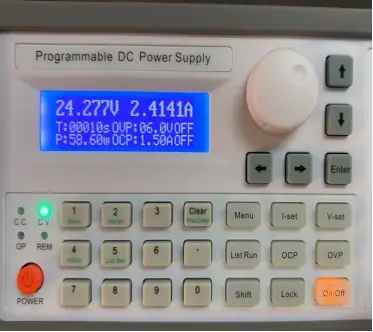
Note: The power-supply display is upstream of the test leads. The voltage-drop calculation uses the separately measured 24.00V value at the LED strip input.
Measured Results at 5 Meters
Sample A
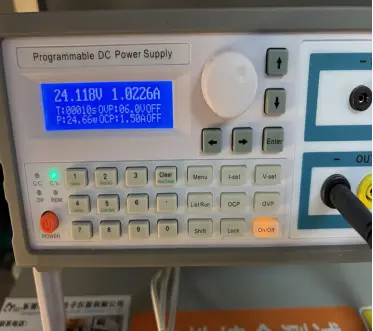
- Measured total power: 24.66W
- Average measured load: 4.93W/m
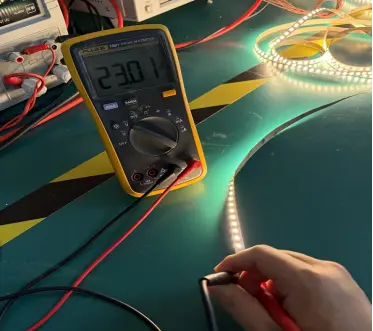
- 5m end voltage: 23.01V
- 5m voltage drop: 4.12%
- Recorded below 5% through: 5m
Sample B
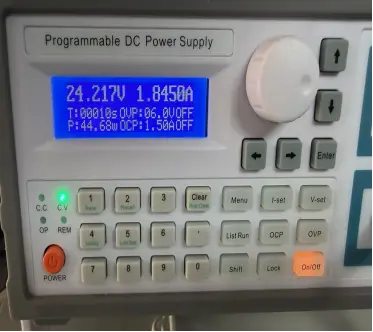
- Measured total power: 44.68W
- Average measured load: 8.94W/m
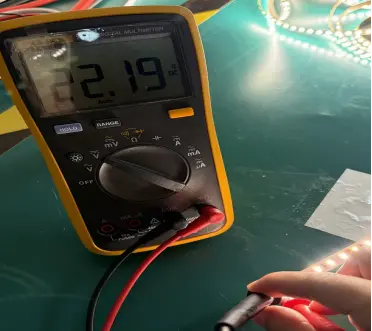
- 5m end voltage: 22.19V
- 5m voltage drop: 7.54%
- Recorded below 5% through: 2m
Sample C
- Measured total power: 58.60W
- Average measured load: 11.72W/m
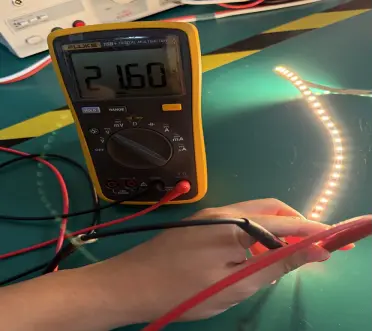
- 5m end voltage: 21.60V
- 5m voltage drop: 10.00%
- Recorded below 5% through: 1m
"Recorded below 5% through" means the longest measurement point that remained below Xmart’s 5% internal comparison criterion in this specific test. It is not a universal installation limit.
Voltage Measured from 1m to 5m
| Distance | Sample A Voltage | Sample A Drop | Sample B Voltage | Sample B Drop | Sample C Voltage | Sample C Drop |
|---|---|---|---|---|---|---|
| 1m | 23.63V | 1.54% | 23.13V | 3.63% | 23.07V | 3.88% |
| 2m | 23.36V | 2.67% | 22.81V | 4.96% | 22.42V | 6.58% |
| 3m | 23.16V | 3.50% | 22.47V | 6.38% | 21.95V | 8.54% |
| 4m | 23.04V | 4.00% | 22.27V | 7.21% | 21.69V | 9.62% |
| 5m | 23.01V | 4.12% | 22.19V | 7.54% | 21.60V | 10.00% |
Voltage drop (%) = (24.00V − measured voltage) ÷ 24.00V × 100.
Values are reported for the tested samples and conditions only. Do not extrapolate these results beyond 5 meters. If you require longer runs, see our 36V / 48V Long-Run LED Strip engineering data.
Voltage Drop by Distance and Load
The measured curves should not be treated as perfectly linear. Voltage-drop performance beyond the tested distance must be verified by a separate test.
What Do These Results Mean for Power-Feed Planning?
| Tested Sample | Measured Result | Preliminary Feed Decision |
|---|---|---|
| Sample A | 4.12% drop at 5m | A 5m single-end feed may be evaluated for the tested load, subject to final assembly verification. |
| Sample B | Below 5% through 2m; 7.54% at 5m | Runs beyond 2m should be evaluated with a second feed, center feed or shorter parallel branches. |
| Sample C | Below 5% through 1m; 10.00% at 5m | Use shorter electrical sections or multiple feed points and retest the complete assembly. |
These are preliminary engineering decisions based on this comparison. Cable length, wire gauge, connector resistance, PCB construction, operating temperature and driver location can change the final result. Learn more about How to Plan Power Injection for Long LED Strip Runs.
Why Can Three 24V LED Strips Produce Different Results?
Electrical Load
A higher-power strip normally draws more current. With the same conductor resistance, increased current can produce a larger voltage drop.
PCB Construction
PCB copper weight, conductor width, PCB width and circuit layout affect resistance along the strip.
Feed Configuration
Single-end, two-end, center and parallel-branch feeds create different current paths and voltage distributions.
Final Connections
Supply cables, solder joints, connectors and waterproof terminations add resistance that was not included in this pre-assembly comparison.
A buyer should therefore specify voltage, measured power, required continuous length and planned feed arrangement—not ask for run length based on voltage alone. See How to Write an LED Strip OEM RFQ for best practices.
Instrument Evidence
The LED strip input was measured separately at 24.00V. The source display is located upstream of the test leads and is shown to document current and total input power.
Sample A Evidence
Sample B Evidence
Sample C Evidence
How Should Buyers Interpret This Evidence?
- One sample was recorded for each tested configuration.
- The results apply only to the tested samples and conditions.
- The test measures electrical voltage, not lumen output, CCT shift, thermal performance or lifetime.
- Measurements were made before final solder-pad tinning and final connector assembly.
- The final product may have additional voltage loss from cables, connectors, solder joints and waterproof terminations.
- The 5% line is an internal engineering comparison criterion, not a universal certification or industry pass/fail standard.
- The data should not be applied automatically to other voltages, PCB constructions, wattages or waterproof versions.
What Should Buyers Provide for a Project-Specific Voltage-Drop Review?
For an OEM or private-label LED strip project, provide the following information so Xmart can evaluate the required feed arrangement:
- Required operating voltage
- Target or measured watts per meter
- Longest continuous electrical section
- Cable length and wire gauge
- Single-end, two-end, center or parallel feed preference
- Aluminum profile, ambient temperature and installation environment
Xmart can then evaluate the PCB, load, connection method and test plan against the intended installation rather than relying on a generic run-length claim.
24V LED Strip Voltage Drop Questions
How far can a 24V LED strip run without power injection?
Does every 24V LED strip support a 5m single-end feed?
Is 5% voltage drop a universal LED strip standard?
Do these results include connectors and supply cables?
Why is the power-supply display slightly higher than 24V?
What should be tested before approving an OEM LED strip?
Request a Voltage-Drop Review for Your LED Strip Project
Send Xmart the required run length, voltage, watts per meter, cable arrangement and installation conditions. Our engineering team can recommend the measurement points and power-feed configuration that should be verified before production approval.